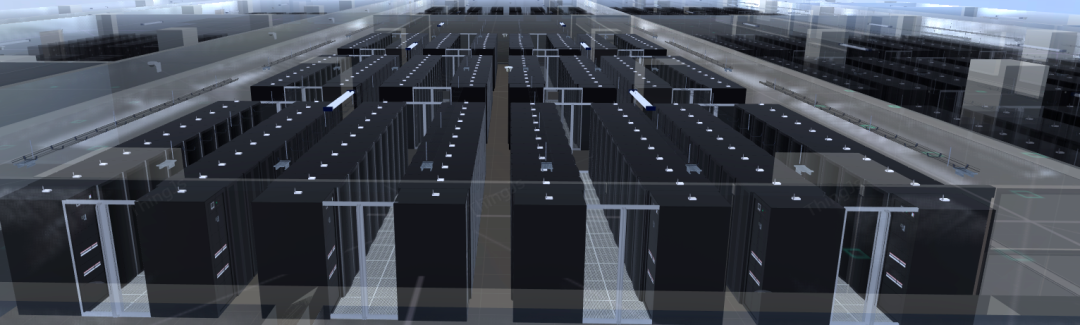
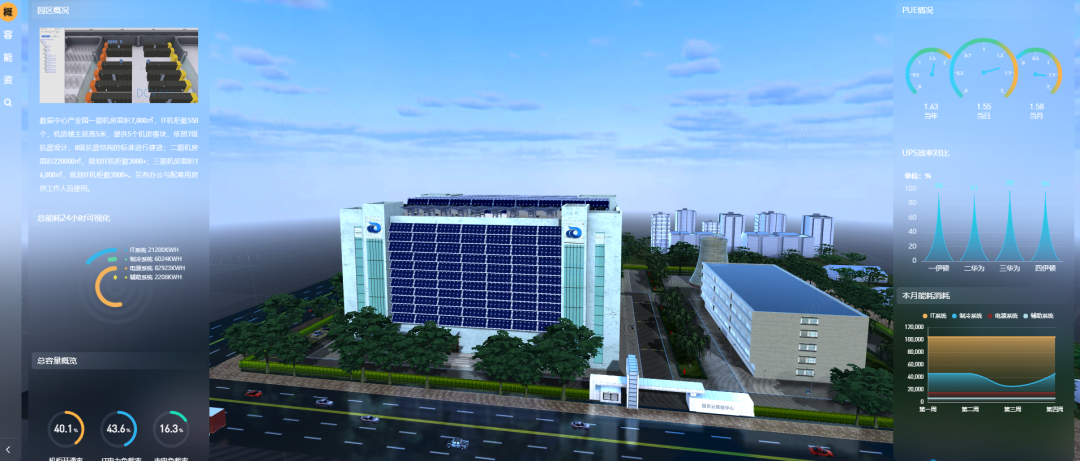
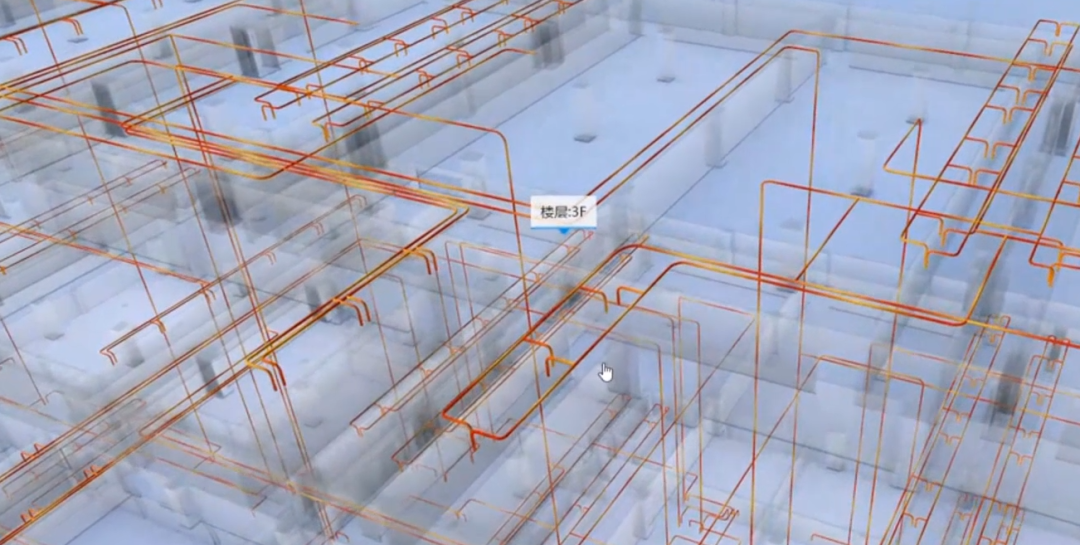
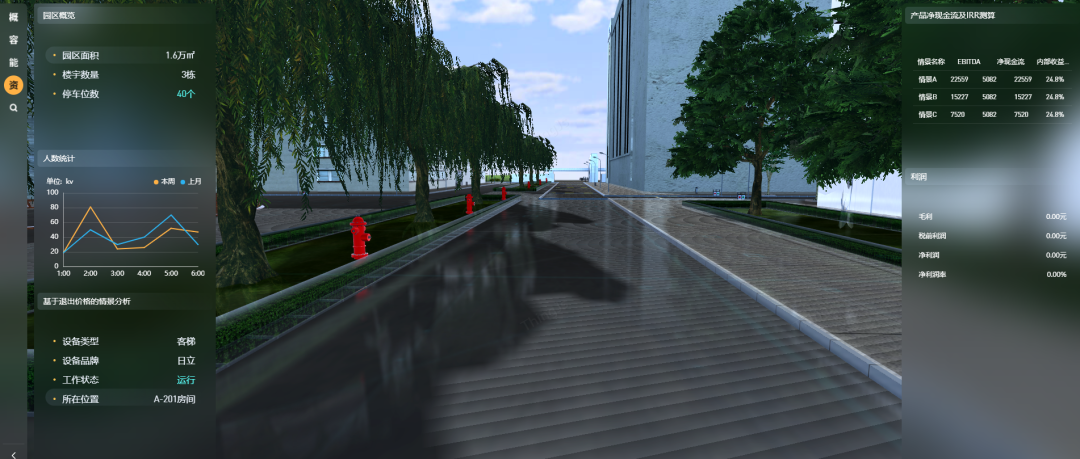
Data Center Visualization O&M Management, Why Data Center Needs Visualization?
Publication Date:2025-03-03
Share to
Data centers are globally collaborative, device-specific networks and are among the most complex systems in the world today.
 
There are many and complex types of equipment in the data center, and too much data is equivalent to no data; Complex and large data centers require multiple systems to manage together, and separate display and operation interfaces undermine mastery; The interface of the management system is monotonous and interactive, which affects the efficiency of information transmission and operation, and reduces the speed of decision-making and response.
 
Therefore, 3D engine technology perfectly solves the problem of data center visualization. Intuitive and rich multi-dimensional kanban boards are highly integrated with data expression, and high-quality communication is conveyed through pipelines, energy consumption visualization and other aspects to meet the needs of core indicators and data presentation reports in business scenarios.
 
 What is data center visual management in the true sense?
We are often faced with visits, peer visits, or work needs from leaders, and we need to let others know about the status of our data center, but due to the wide distribution or lack of interest and energy to think about it on the ground. This is where the use of 3D scenes is very important.
 
The real data center campus is restored 1:1 through the visualization platform, and the latest 3D graphics engine is used to simulate the data center 360-degree panoramic view, presenting the location of each monitoring point in the data center computer room and the distribution of cabinets and equipment in the data center computer room from multiple angles and dimensions. Quickly search, accurately locate, instantly move to the equipment of interest in the huge data center computer room, and fully grasp the real-time changes in the computer room environment. Provide IT managers with a visual means for resource operation and maintenance management. The system can customize various models online based on the characteristics of the user's industry and business.
Adopt a new 3D engine to create a visual data center with panoramic simulation
Using the latest 3D graphics technology, all assets, equipment, network wiring, and data center capacity in the data center or computer room are virtually simulated, and the entire data center or data center environment is built in full 3D mode. The system design is flexible and easy to use, and the interface is simple and beautiful. The 3D scene can be operated with the mouse, and the 3D scene can be zoomed in or out, panned up, down, left and right, and rotated at any angle, and can be browsed at the data center level, computer room level, cabinet level, equipment level and port level in a hierarchical and progressive manner. Through the 3D engine technology, the accurate modeling of various devices in the computer room is realized, and a multi-perspective, multi-dimensional hierarchical virtual reality environment is also built.
Multi-dimensional information kanban leaves no dead ends in management
Visualization can not only depict objects seen with the naked eye in images, but also express the information state of the device. Through various visual charts such as machine position, U position, and power consumption, the operation and maintenance personnel of the computer room will have a clearer grasp of the current capacity, such as the current power load of the computer room, the remaining space of the cabinet, the load-bearing situation of each area of the computer room, and the storage capacity.
 
The capacity visual management function also supports the space search function to accurately calculate and display the used and available space. Assist personnel to quickly find suitable shelf space for new equipment and pinpoint the required space. Multi-dimensional Kanban deeply collects data to make the use of basic resources clear at a glance.
Deploy pipelines in the computer room to improve operational efficiency
Use 3D visualization to sort out the distribution and routing of increasingly dense electrical pipelines and network lines in data centers, so as to quickly troubleshoot and repair pipeline faults, and improve the level of pipeline management and fault resolution efficiency. Pipeline visualization efficiently improves user efficiency in operation through precise positioning and complete link information presentation.
Energy consumption can be visualized and quantified to create a green data center
Energy consumption can be visualized and quantified, achieving refined cost management and improving energy efficiency. Provide IT managers with energy consumption analysis data, intuitively reflect the utilization of energy consumption through rich statistical charts, grasp the energy consumption of each system in different dimensions through charts, help IT managers do a good job in energy consumption planning, improve energy efficiency, be more energy-saving and environmentally friendly, and build a green data center.
summary
In the context of digital survival, governments, enterprises, industry organizations, etc. have successively carried out digital transformation and transformation, establishing strategic choices and resource investment to build digital capabilities. Digital technology will continue to deepen, new models will continue to emerge, more organizational innovation will be expanded, and more research directions will observe, discover or organize richer content from different perspectives.
 
In the era of big data, we are generating massive data like never before, and there is a lack of "intuitive response" in the chaotic and complex data torrent, and "rational thinking" will become more and more overwhelmed. Data visualization can optimize the expression rate of information through graphical elements, reduce the processing burden of the brain's subconscious mind to help people access the information behind the data faster and easier, and also give decision-makers more time to think rationally, and the two synergistically improve the efficiency and reliability of the entire decision-making process.
Related Newsmore